LearnUCS Statistics for July 2015
Application Insight
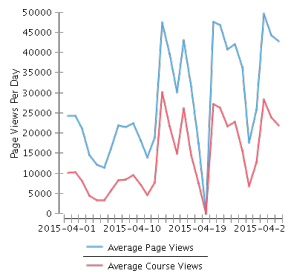
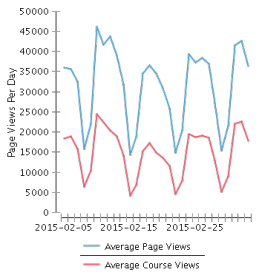
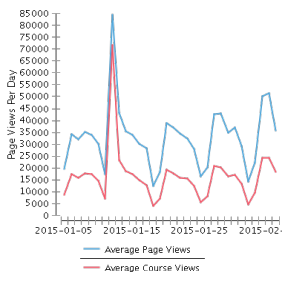
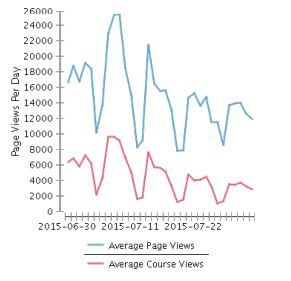
Total Page Views
|
646,692
|
Average Page Views Per Day
|
Non course - 14,970
Course - 4,649
|
Most Active Date
|
Non Course - 25,498- 9 July 2015
Course - 9,679 - 8 July 2015
|
Application Metrics
Total Monthly Logins
|
18,639
|
Total Number of Courses
|
9792
|
Total Number of Active Courses
|
1396
|
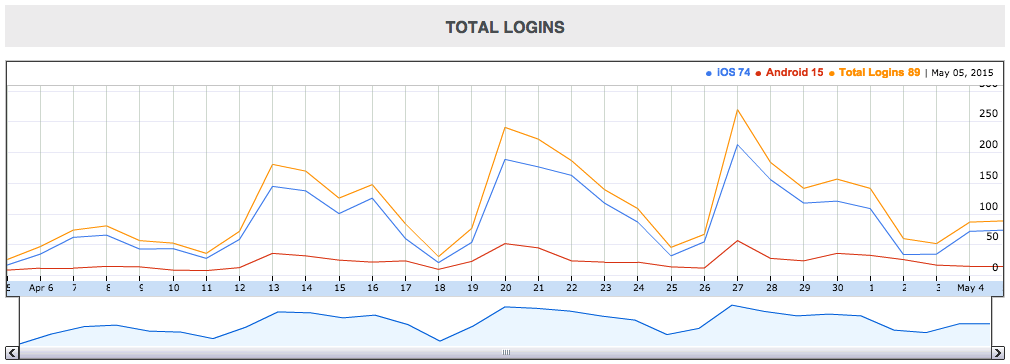
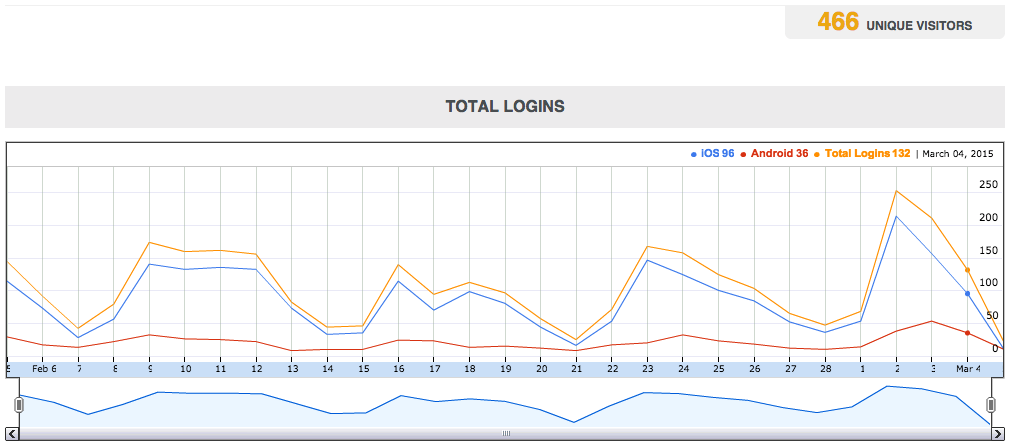
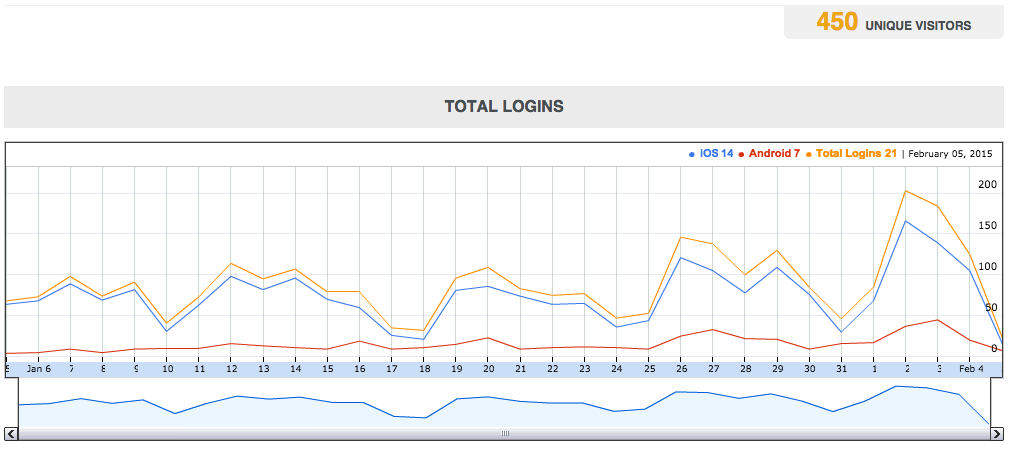
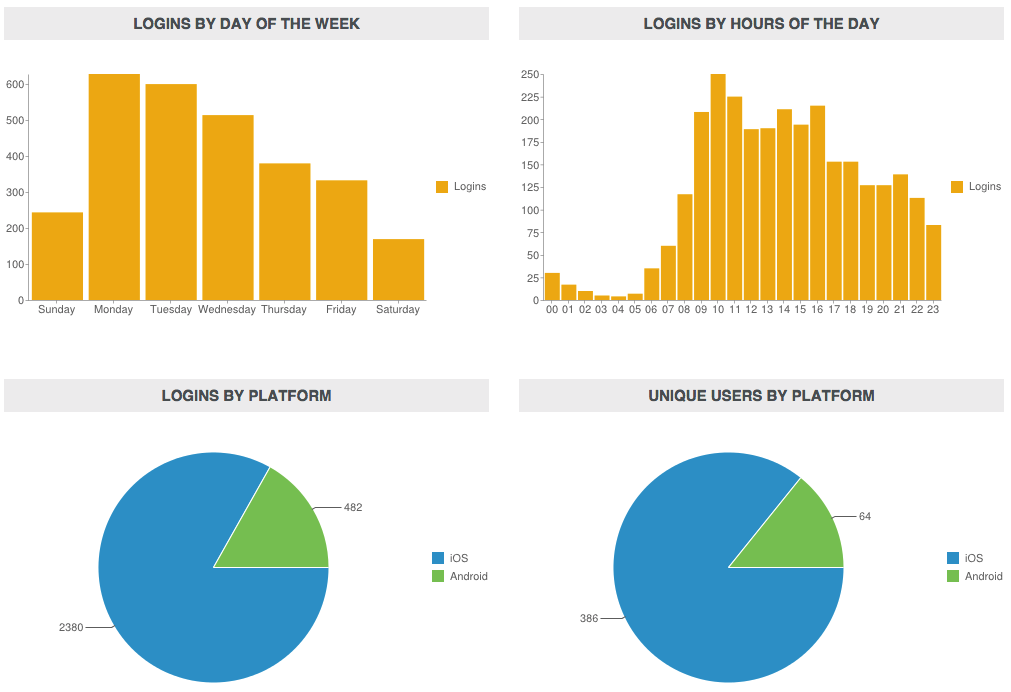
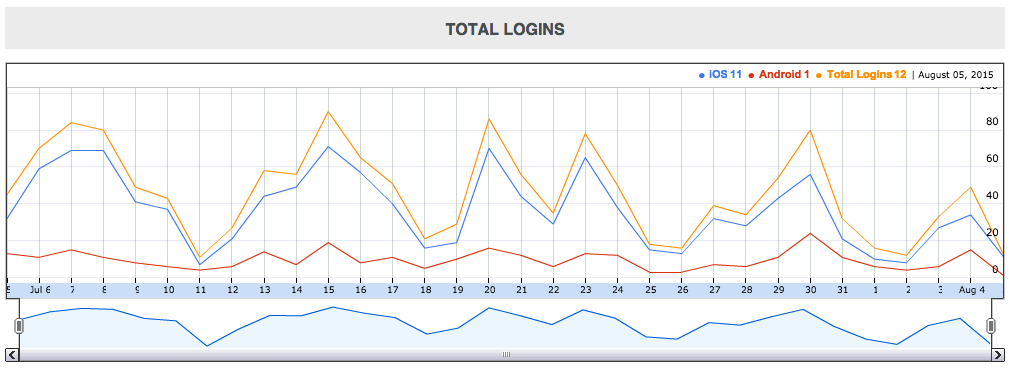
LearnUCS Mobile Statistics for 5th July 2015 to 4th August 2015
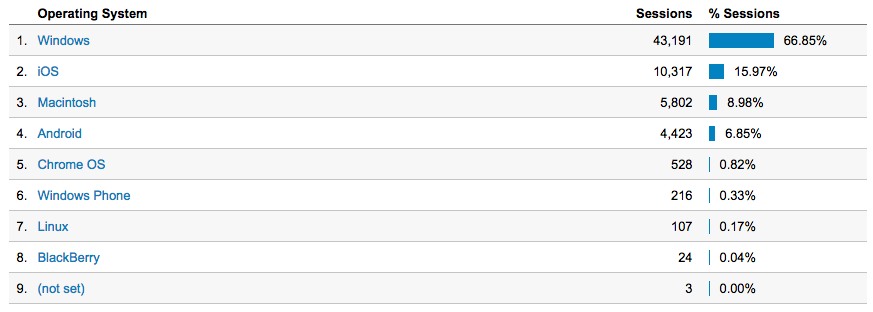
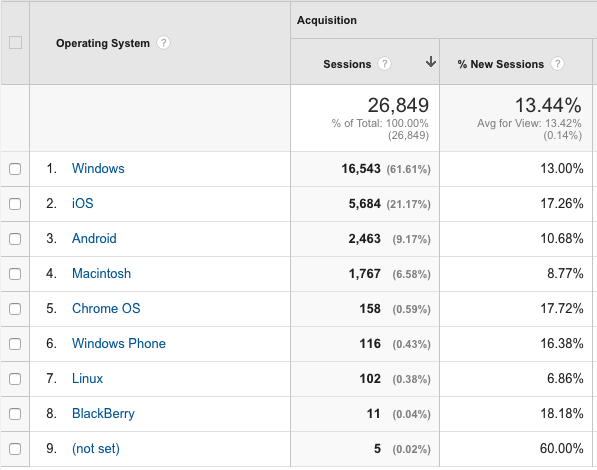
The stats below are using the built-in Blackboard mobile analytics, which uses the mobile service for the mobile application for its data.Since April we have been using Google Analytics on our Blackboard installation, this does not take into account those users using the mobile app. It is interesting to see that iOS is still the second most used operating system. Which means users are using their smart devices to access LearnUCS via a browser rather than the available app.
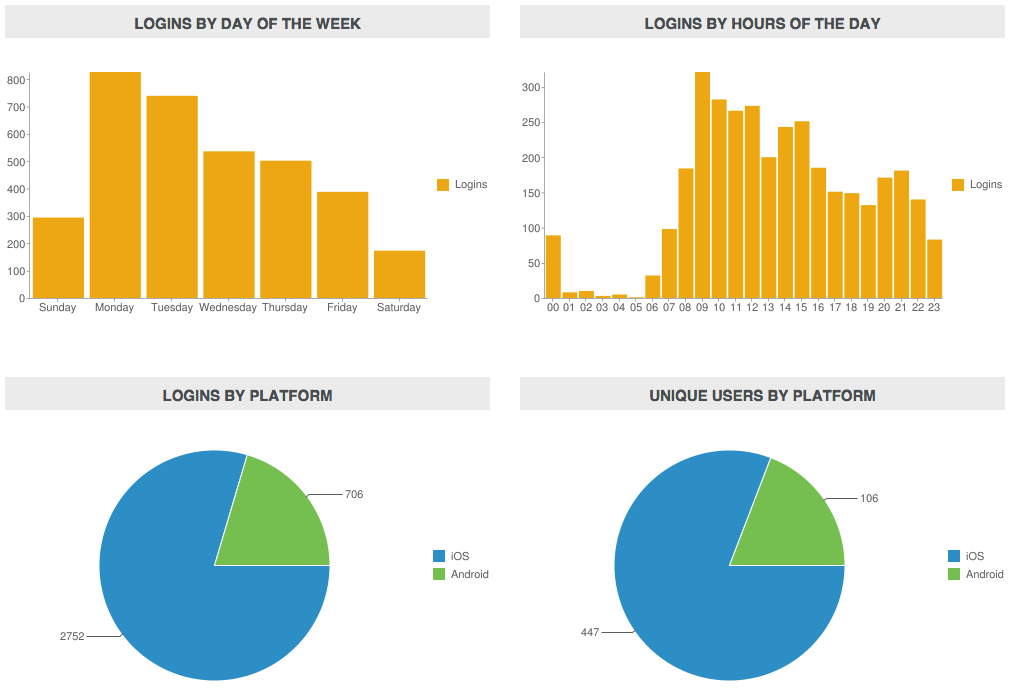
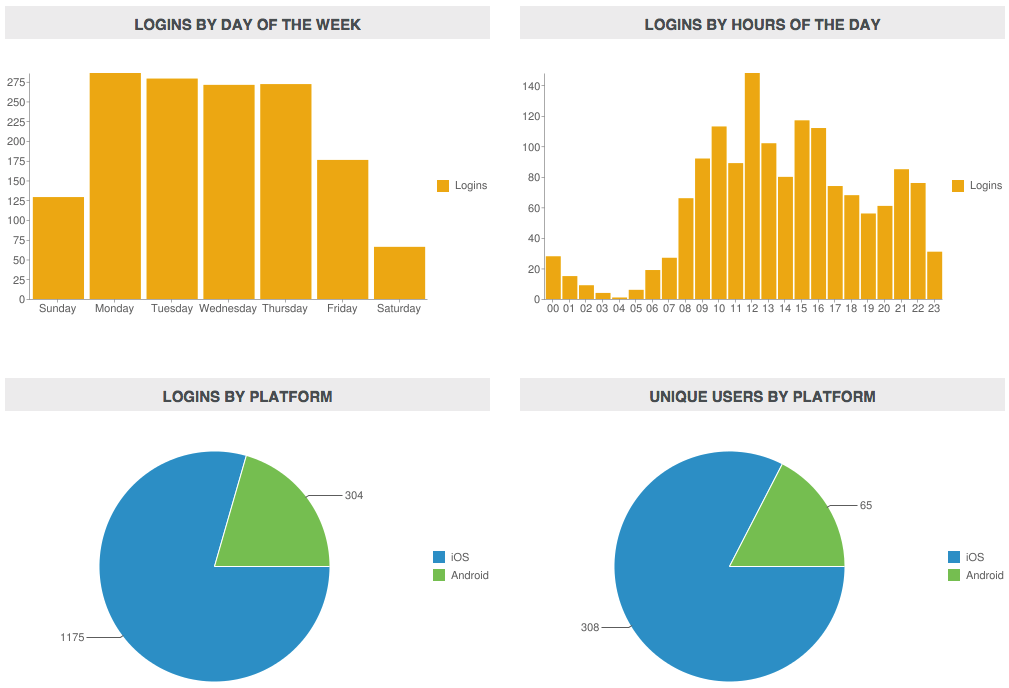
These stats are for the Mobile Learn application only.
Total unique logins for the period was 373 with 1,479 logins.
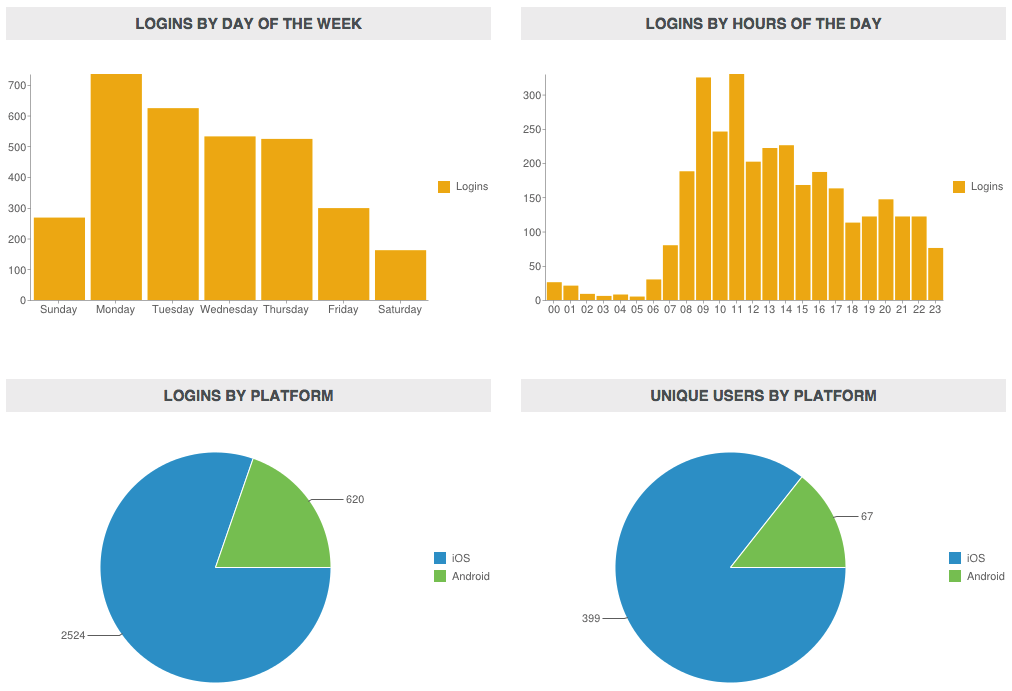
iOS is still the most popular operating system for those devices.
We have had continued fall in the number of active module this month, this follows the trend of the end of year with students finishing their studies, with staff and students no longer requiring access to those materials. We will see a continued drop on all stats until the start of the new academic year.